Measure What Matters: TikTok Analytics for Content Success

"What gets measured, gets managed," says Peter Drucker, a management guru. This principle is especially true in the digital age. Creating content without measuring its impact is like sailing without a compass—you're adrift without direction.
If you're an e-commerce business owner, digital marketer, content creator like me, or someone passionate about sharing your creations with the world, boosting your online presence, driving business growth, and increasing sales, then measuring your efforts is essential.
Are you producing TikTok videos but unsure how to interpret the data behind them? This article is your guide.
Whether you're new to TikTok or looking to refine your strategy, understanding the platform's algorithm and effectively using analytics can dramatically enhance your reach and engagement.
TikTok has quickly become a major player in social media, offering huge opportunities for content creators and businesses. To fully take advantage of TikTok, it's important to master its analytics.
Analytics offer a wealth of insights into who your audience is and how they interact with your content. For businesses and growing brands, TikTok analytics can be a game-changer, allowing you to create shoppable videos that directly drive sales. By embedding your trending TikTok videos on your website and overlaying them with shoppable links, you can turn viewers into customers instantly. Sharelo's shoppable video platform makes this integration seamless, boosting your sales effortlessly.
In this blog post, we'll delve into the essential metrics you need to track, how to interpret these insights, and how to utilize this data to refine your content strategy and fuel your business growth.
1. Understanding TikTok Analytics
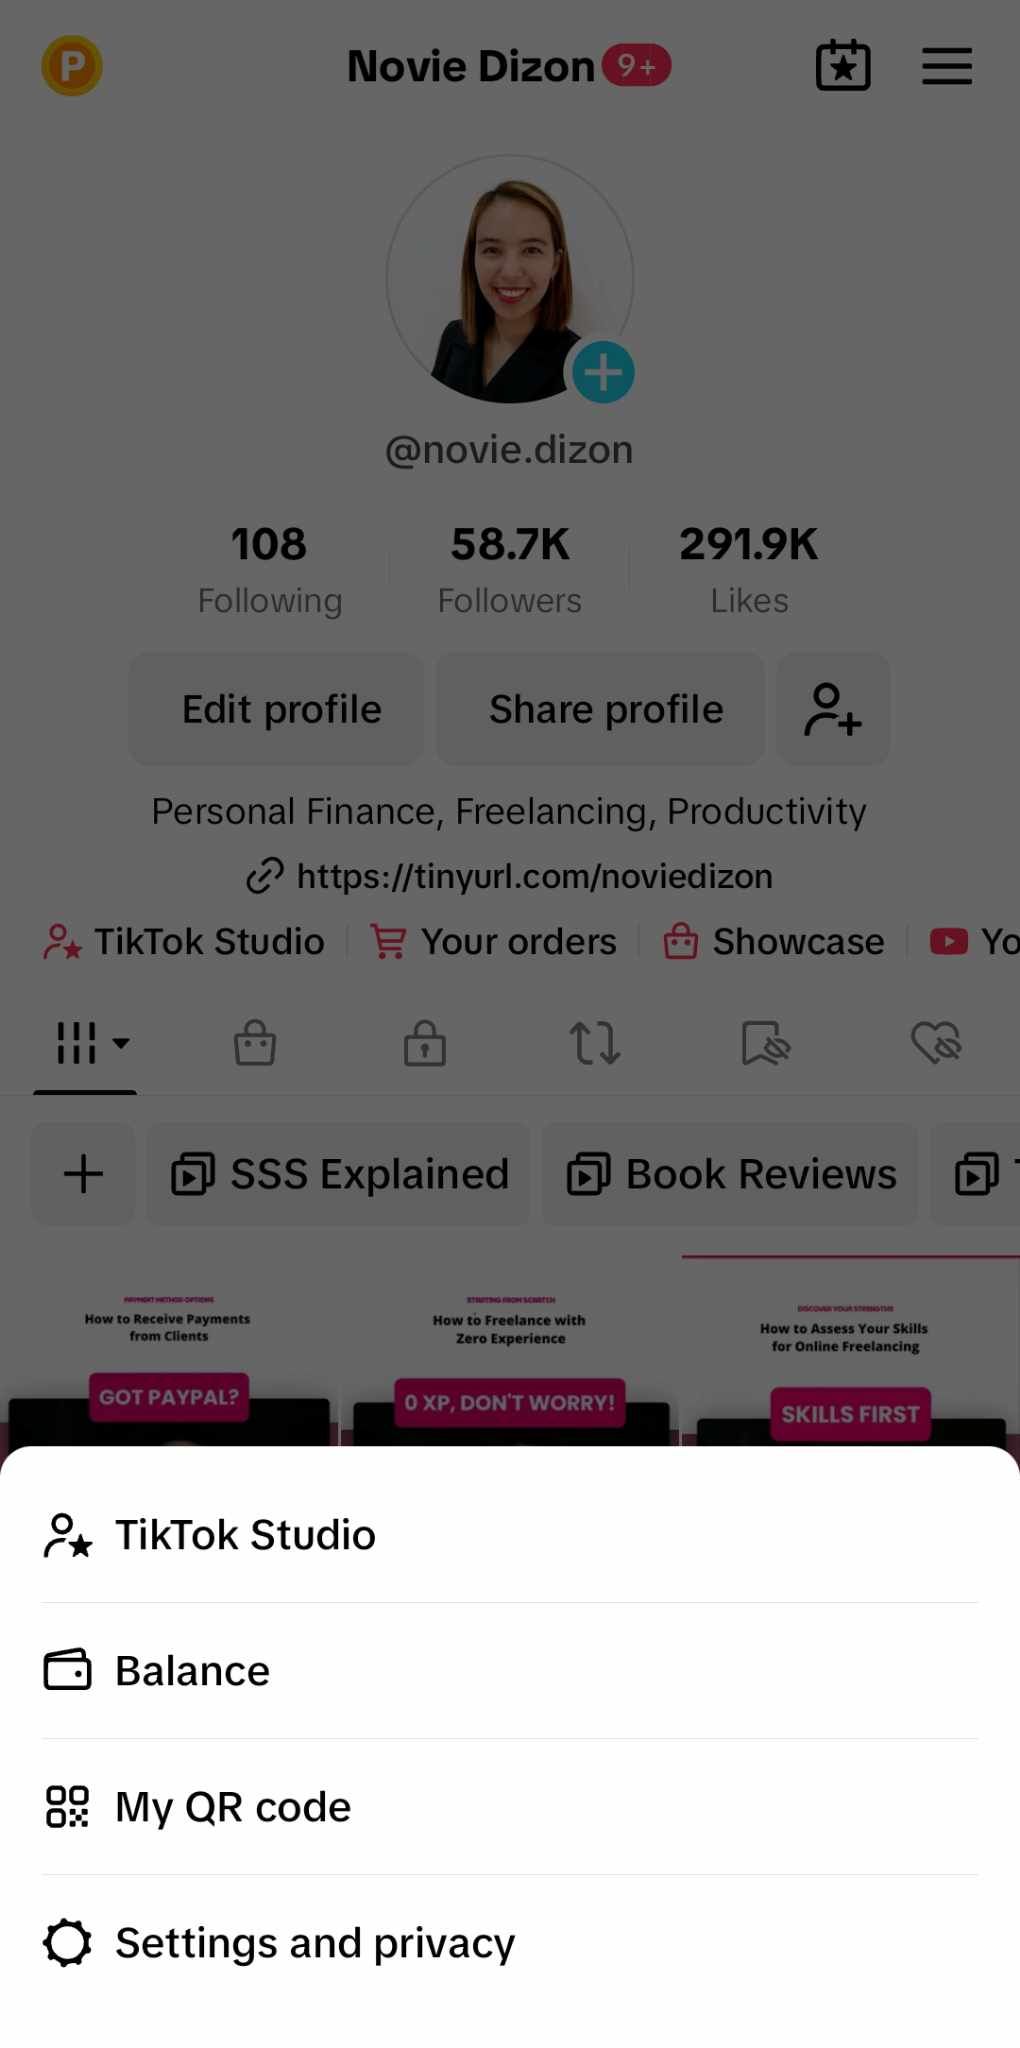
Before diving into specific metrics, it's crucial to know where to find TikTok analytics. To access your analytics, go to the three-line menu on the upper right corner of your screen, select TikTok Studio, then you will see an overview of your Analytics. Click "View All" to view the comprehensive Analytics of your TikTok Account. I usually analyze my content every month and plan my next content strategy accordingly.
2. Key Metrics to Track
TikTok analytics are divided into five main categories: Overview, Content, Viewers, Followers, and LIVE. Each category provides valuable insights into different aspects of your account's performance.
a. Overview
Here’s how an Overview tab of Analytics look like:
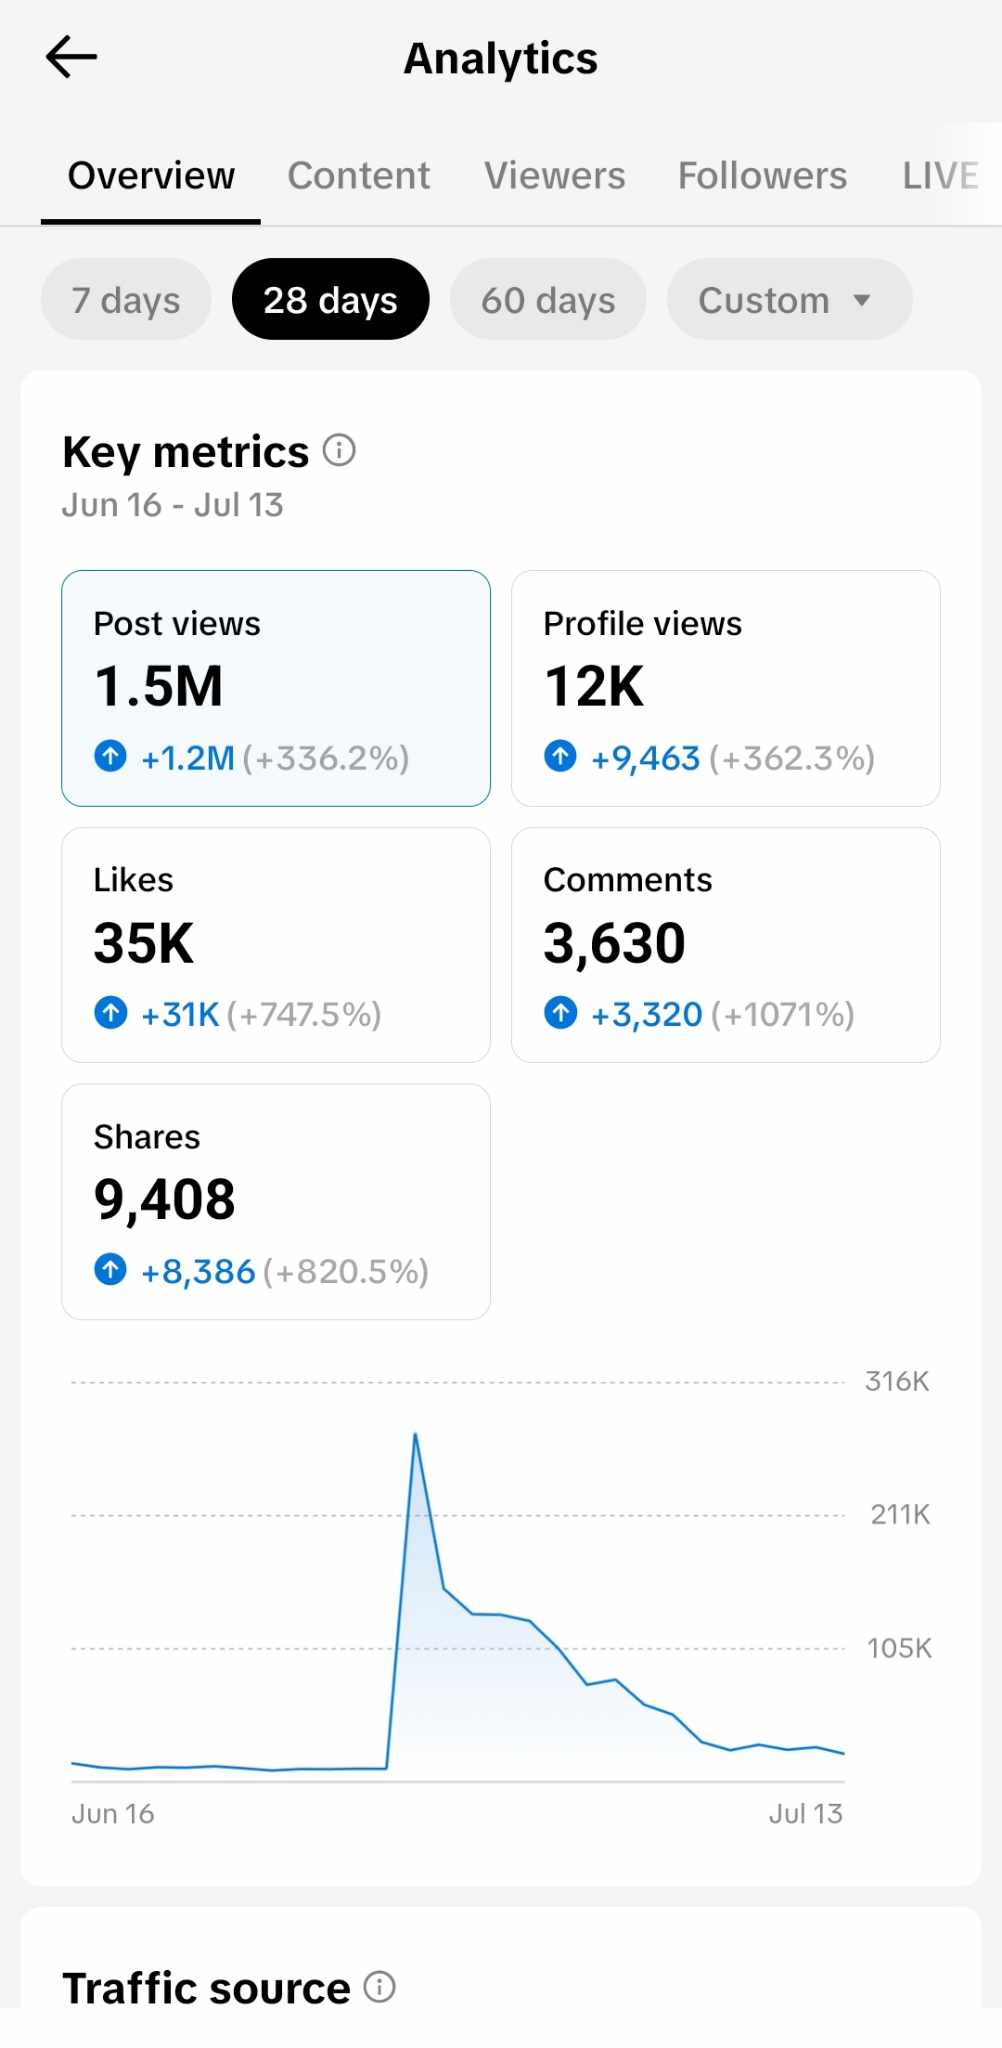
- Post Views: The total number of times your posts (videos and images) have been watched. This helps you understand the reach and popularity of your content.
- Profile Views: The number of times your profile has been viewed. This metric indicates how many people are interested in learning more about you or your brand.
- Likes: The total number of likes your posts have received. High likes generally indicate that your content is resonating with your audience.
- Shares: The number of times your posts have been shared. Shares can greatly increase the reach of your content.
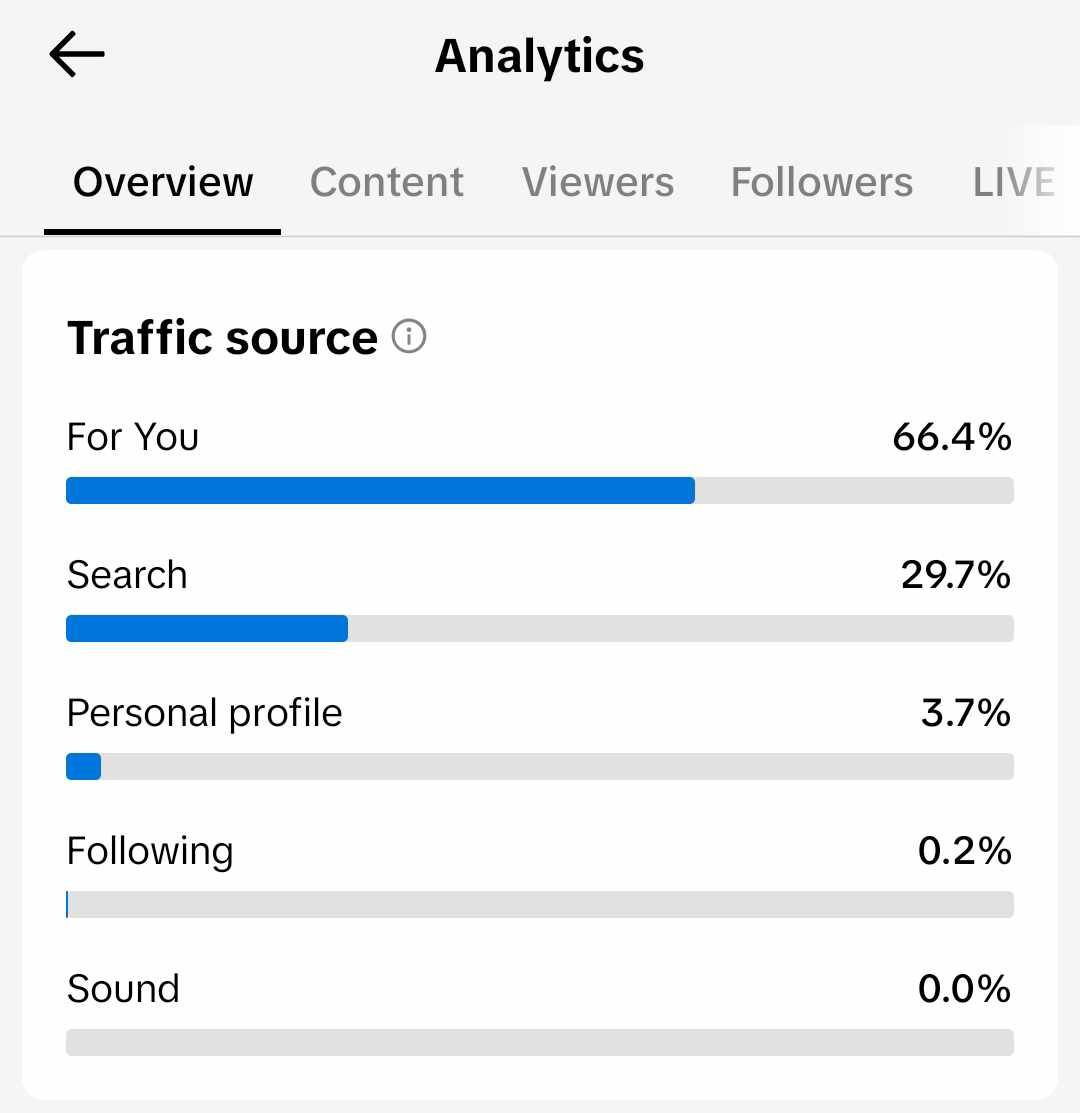
- Traffic Source: Identifies where your viewers are coming from, such as "For You," "Search," "Personal Profile," "Following," and "Sound."
- Search Queries: Displays the keywords users are typing to find your content.
b. Content

- Video Performance: Shows the performance of individual videos, including total views, likes, comments, and shares, and how many followers you have gained from those videos. This helps identify which content resonates best with your audience.
- Trending Videos: Highlights your top-performing videos. Use this insight to understand what type of content works well and replicate its success.
c. Viewers
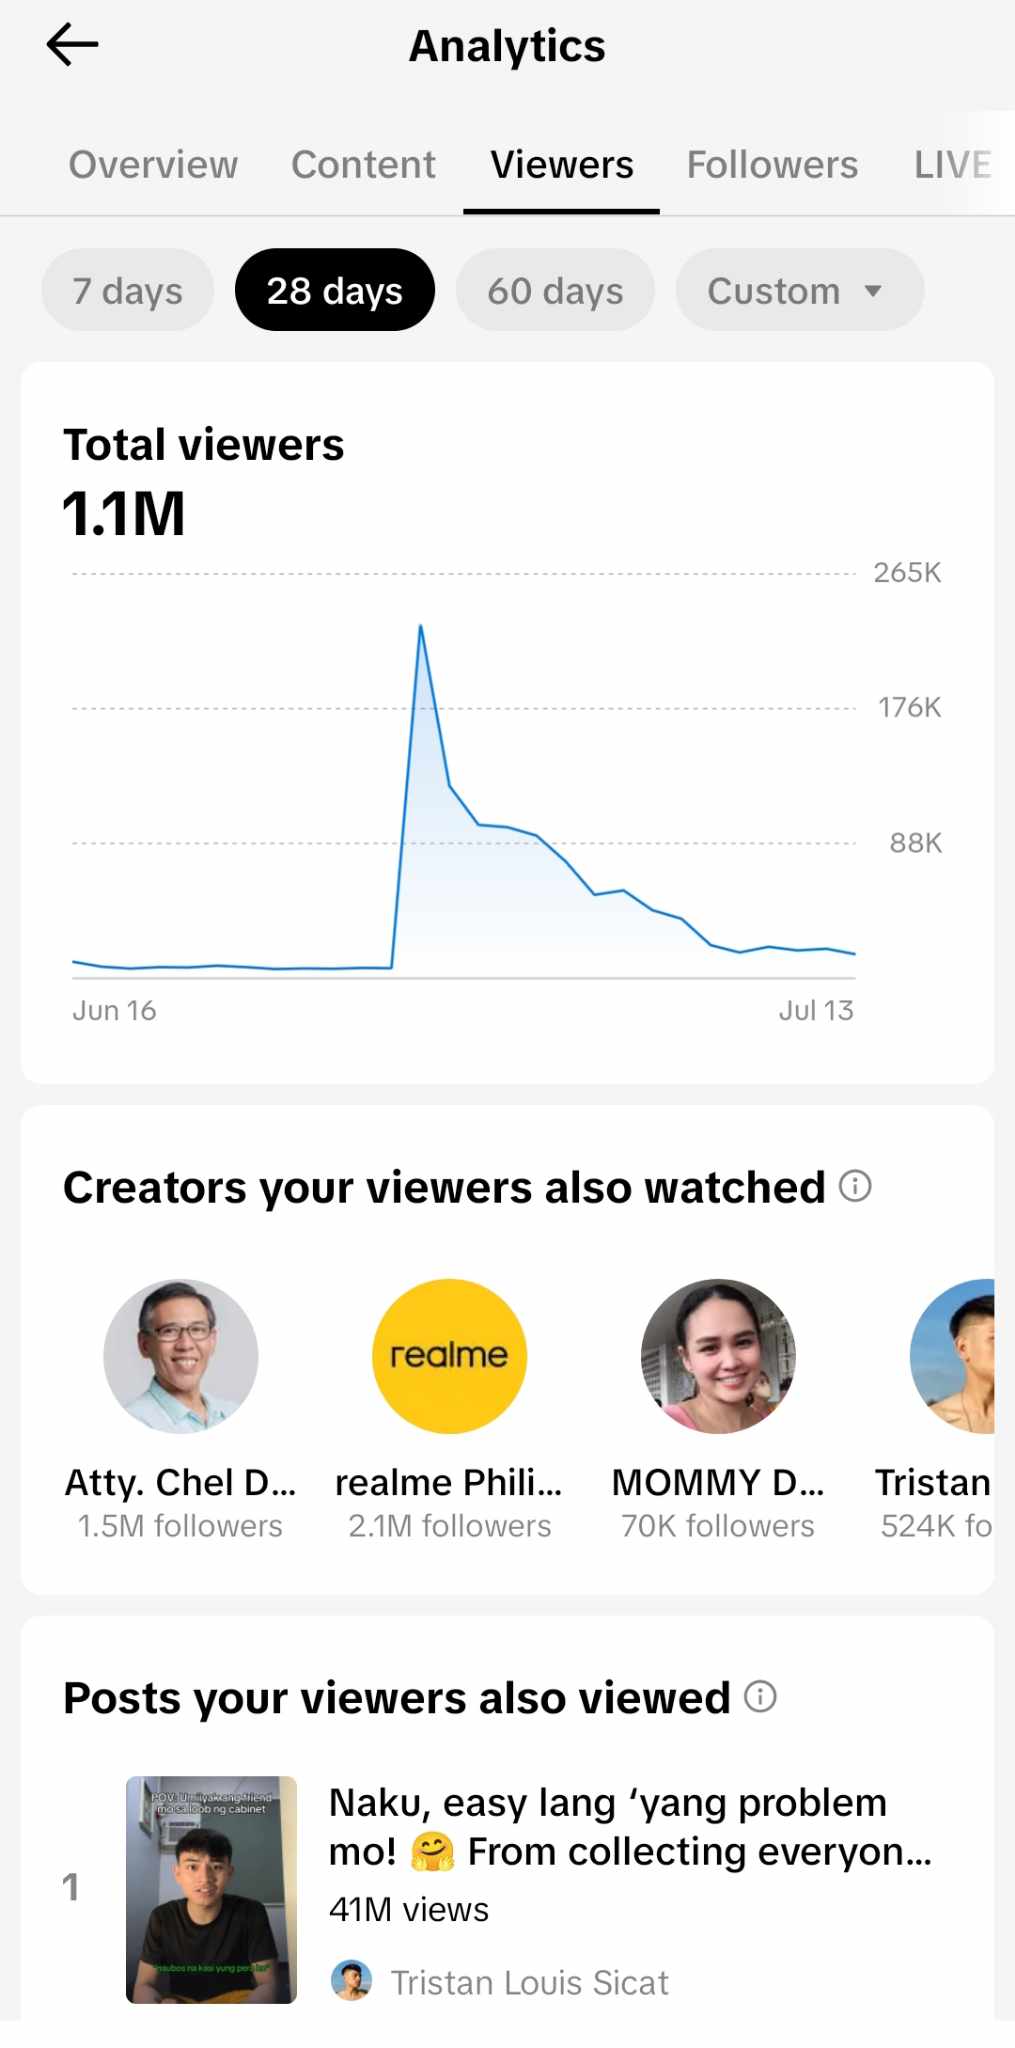
- Total Viewers: The number of unique users who have watched your content.
- Creators Your Viewers Also Watched: Provides insight into other creators your audience is interested in, helping you understand their preferences.
- Posts Your Viewers Also Viewed: Shows other posts your audience is engaging with, giving you ideas for similar content.
d. Followers
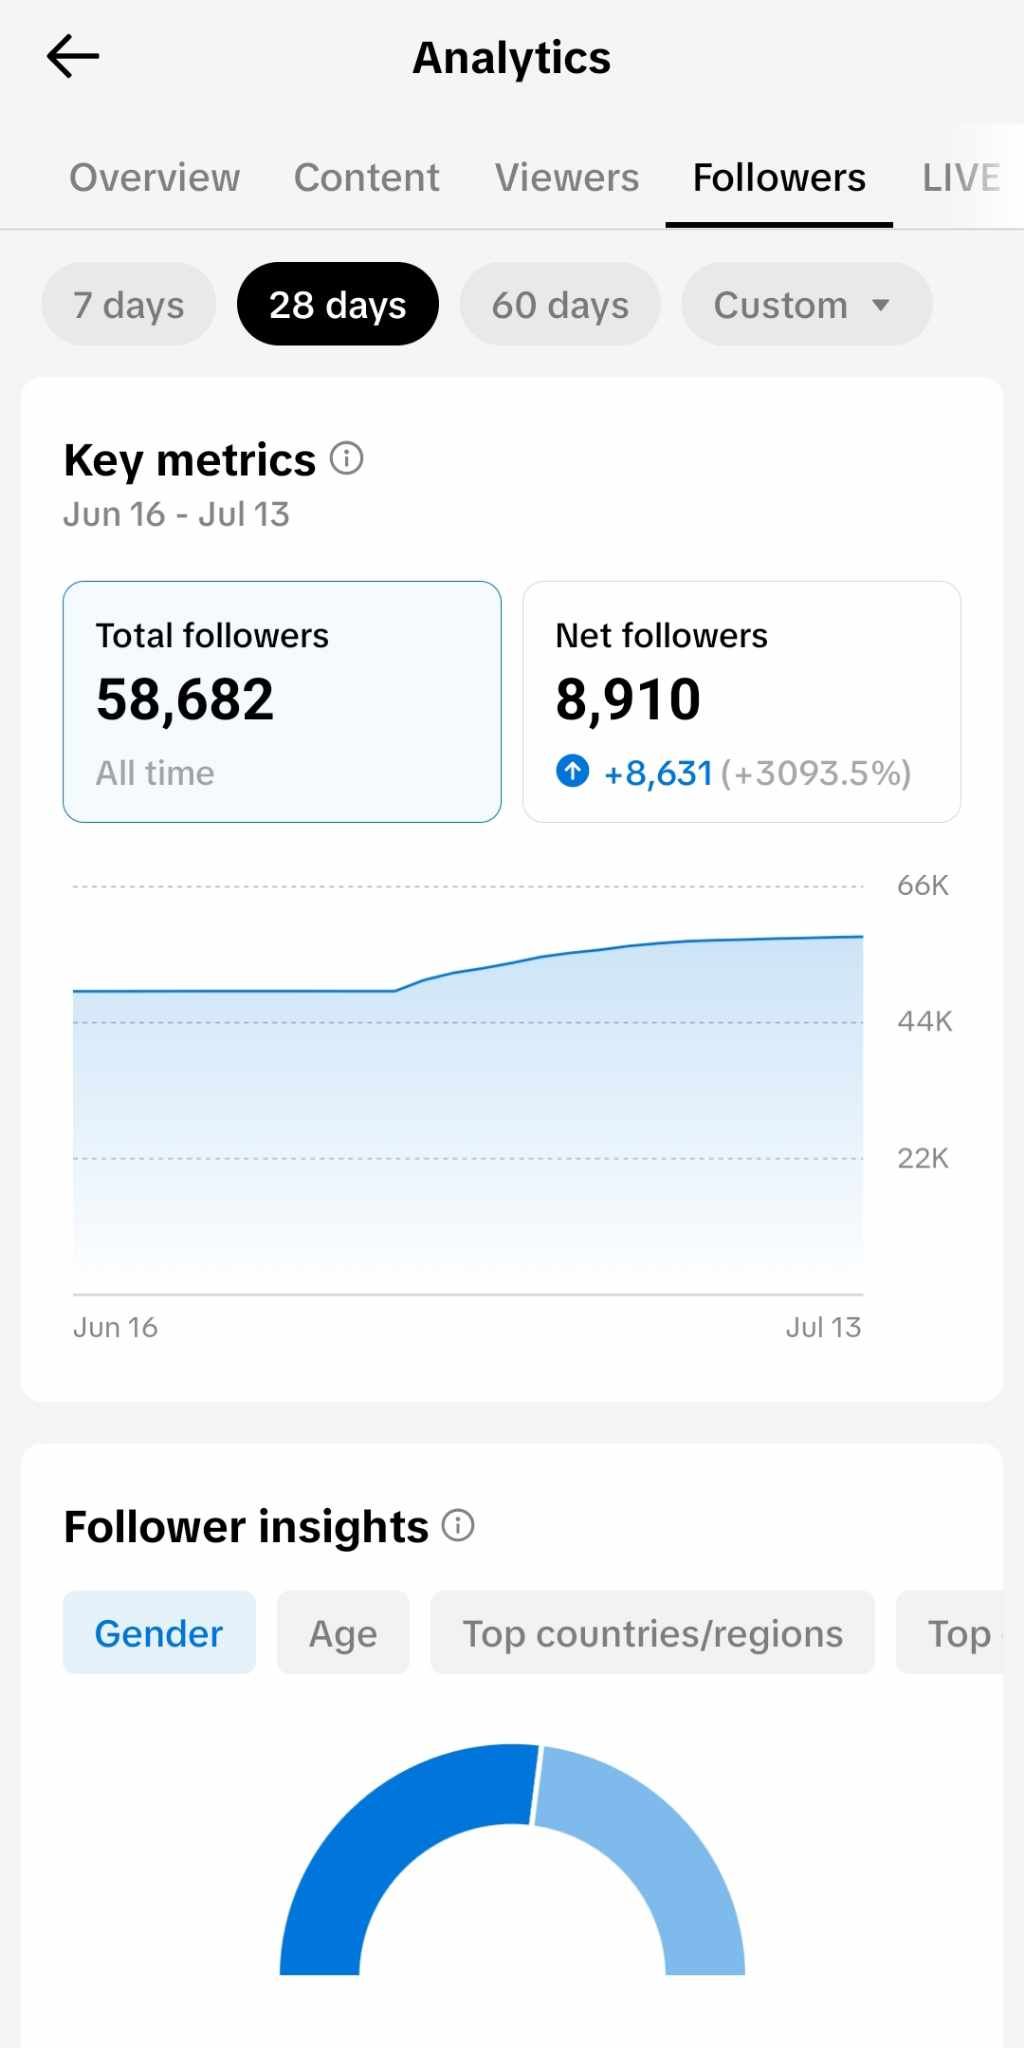
- Follower Demographics: Provides insights into the age, gender, and geographic location of your followers. Understanding your audience demographics can help tailor your content to better suit their preferences.
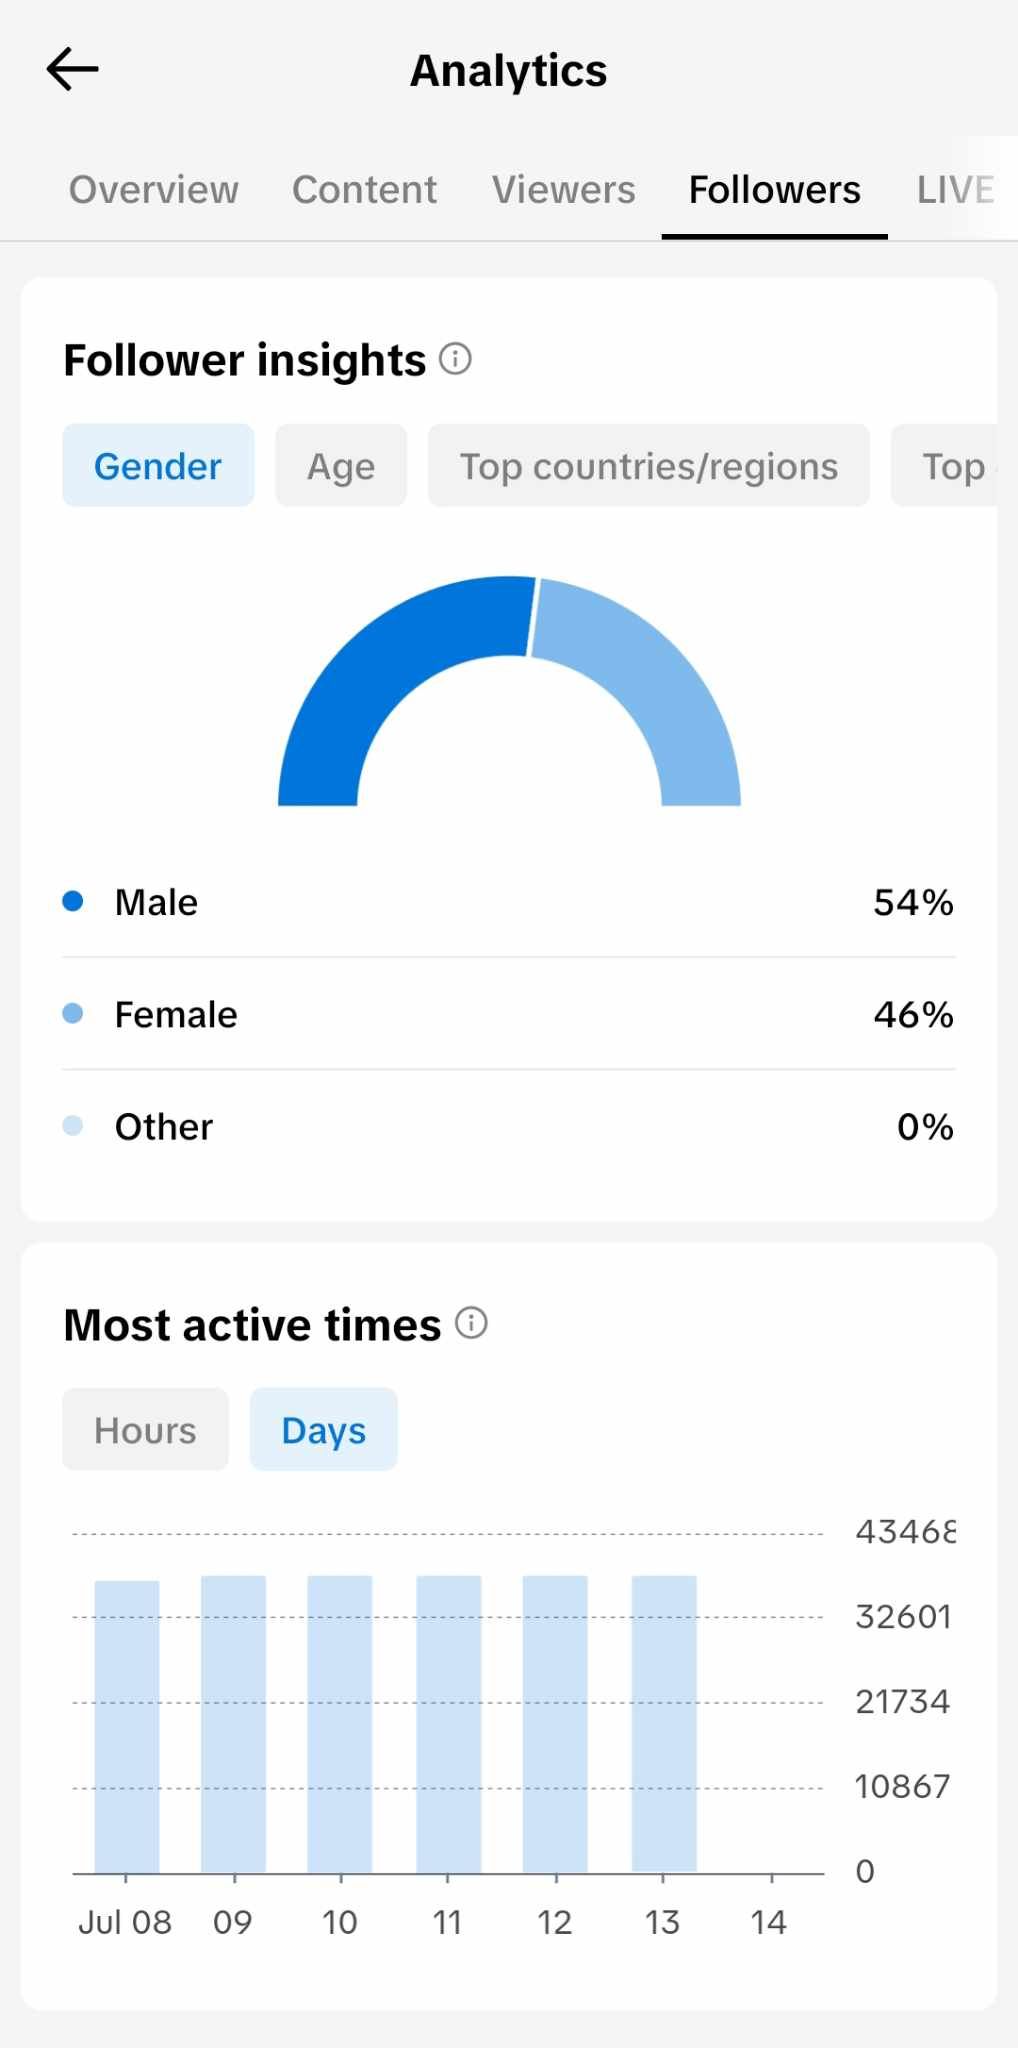
- Follower Activity: Shows when your followers are most active on TikTok. Posting during peak times can increase your content's visibility and engagement.
- Follower Growth: Tracks the increase or decrease in followers over a specific period. A growing follower count signifies rising interest and engagement.
e. LIVE
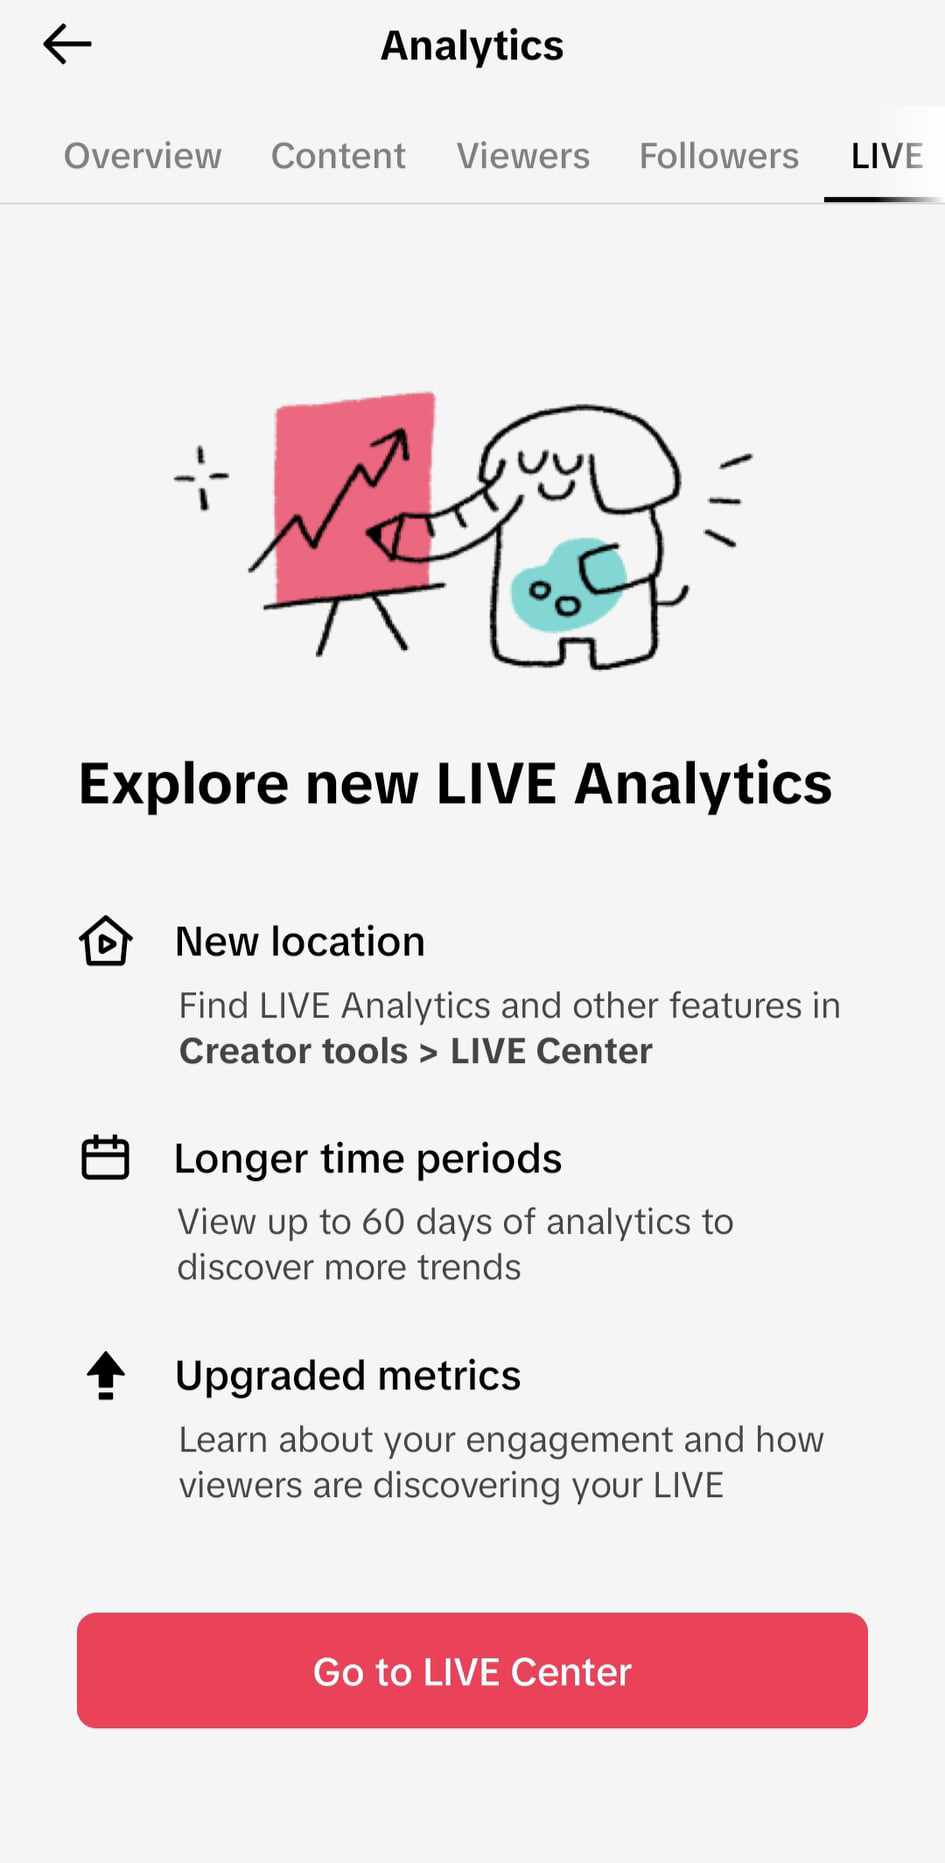
Since I don't go live yet, there's no data to show in the image above. However, below are the key metrics you'd see on the TikTok LIVE dashboard when you start live streaming
- Live Stream Views: The number of views on your live streams.
- Total Watch Time: The total amount of time viewers have spent watching your live streams.
- New Followers from LIVE: Tracks how many new followers you gained from your live streams.
3. Interpreting the Data
Once you have a grasp of the key metrics, the next step is interpreting the data to make informed decisions.
a. Engagement Rate
Engagement rate is a critical metric that combines likes, comments, and shares. A high engagement rate indicates that your content resonates well with your audience. Calculate it by dividing the total engagements by the total views and multiplying by 100 to get a percentage.
So for example I have 1.5M views, and has a total likes and shares, comments of 500k, so my engagement rate is 33%.
b. Audience Insights
Analyzing follower demographics and activity can help you refine your content strategy. For example, if most of your followers are active in the evenings, schedule your posts accordingly to maximize visibility. My audience are usually active during noon time.
c. Content Performance
Identify patterns in your top-performing videos. Are there specific themes, formats, or hashtags that consistently perform well? Use these insights to guide your future content creation.
4. Using Analytics to Improve Your Strategy
With a clear understanding of your TikTok analytics, you can make data-driven decisions to enhance your content strategy.
a. Experiment and Iterate
Use the insights from your analytics to experiment with different types of content. Track the performance of these experiments and iterate based on what works best.
b. Optimize Posting Times
Leverage follower activity data to post during peak times. This can significantly boost your content's reach and engagement.
c. Engage with Your Audience
Pay attention to the comments and feedback from your followers. Engaging with your audience not only fosters a sense of community but also provides valuable insights into their preferences and interests. I make sure to at least engage with my audience once a week, replying to their comments, giving likes, and sharing their content.
d. Collaborate and Trend
Stay updated with TikTok trends and consider collaborating with other creators. Trends can boost your visibility, and collaborations can introduce your content to new audiences.
Conclusion
Measuring success on TikTok goes beyond just counting views and likes. By diving into the platform's analytics, you can gain valuable insights into your audience, understand what content performs best, and continuously improve your strategy. With a data-driven approach, you can maximize your impact on TikTok and achieve your goals as a content creator or business.
When a video goes viral, I usually recreate that video and make more videos on similar topics. This keeps my viewers coming back for more. Additionally, I create new topics to target new audiences since I talk about personal finance, freelancing, and productivity. My top videos are about personal finance because I was a former financial advisor. Now, as a freelancer, I create content about freelancing, hoping to attract a new audience.
Now you already know how to track the performance of your videos. When you have an overview of what type of audience you are attracting, it’s easier to create content that resonates with them. For example, my audience's age range is from 25-34, so I create content suitable for that age group. This strategy helps increase my engagement rate and views.
Measure Success and Drive Business Growth
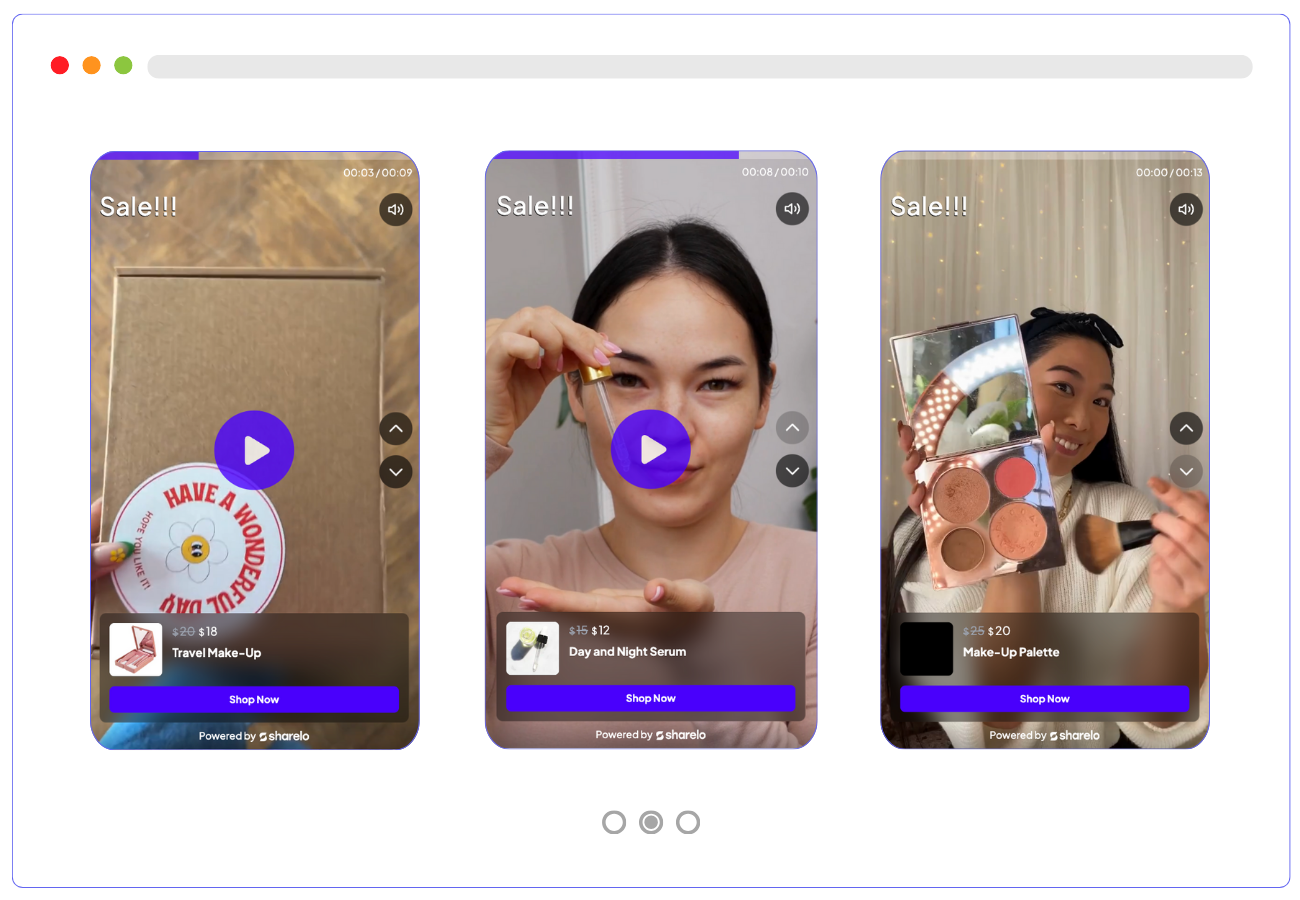
If you have a trending video on TikTok, leverage it by downloading and embedding it on your website. You can create a TikTok-like experience on your website and boost sales with your trending videos. Embed products or shoppable links in your videos and take your audience to shop within the video using Sharelo's shoppable video platform.
With Sharelo's shoppable video, you can upload your existing trending TikTok videos and create a pop-up, grid, or carousel view embedded on your website. Your website is your one-stop shop, so maximize it and get your visitors to shop within the video.
Sharelo also has real-time analytics, giving you insights into the engagement rate of your content. With these insights, you can measure success and strategize your next move.
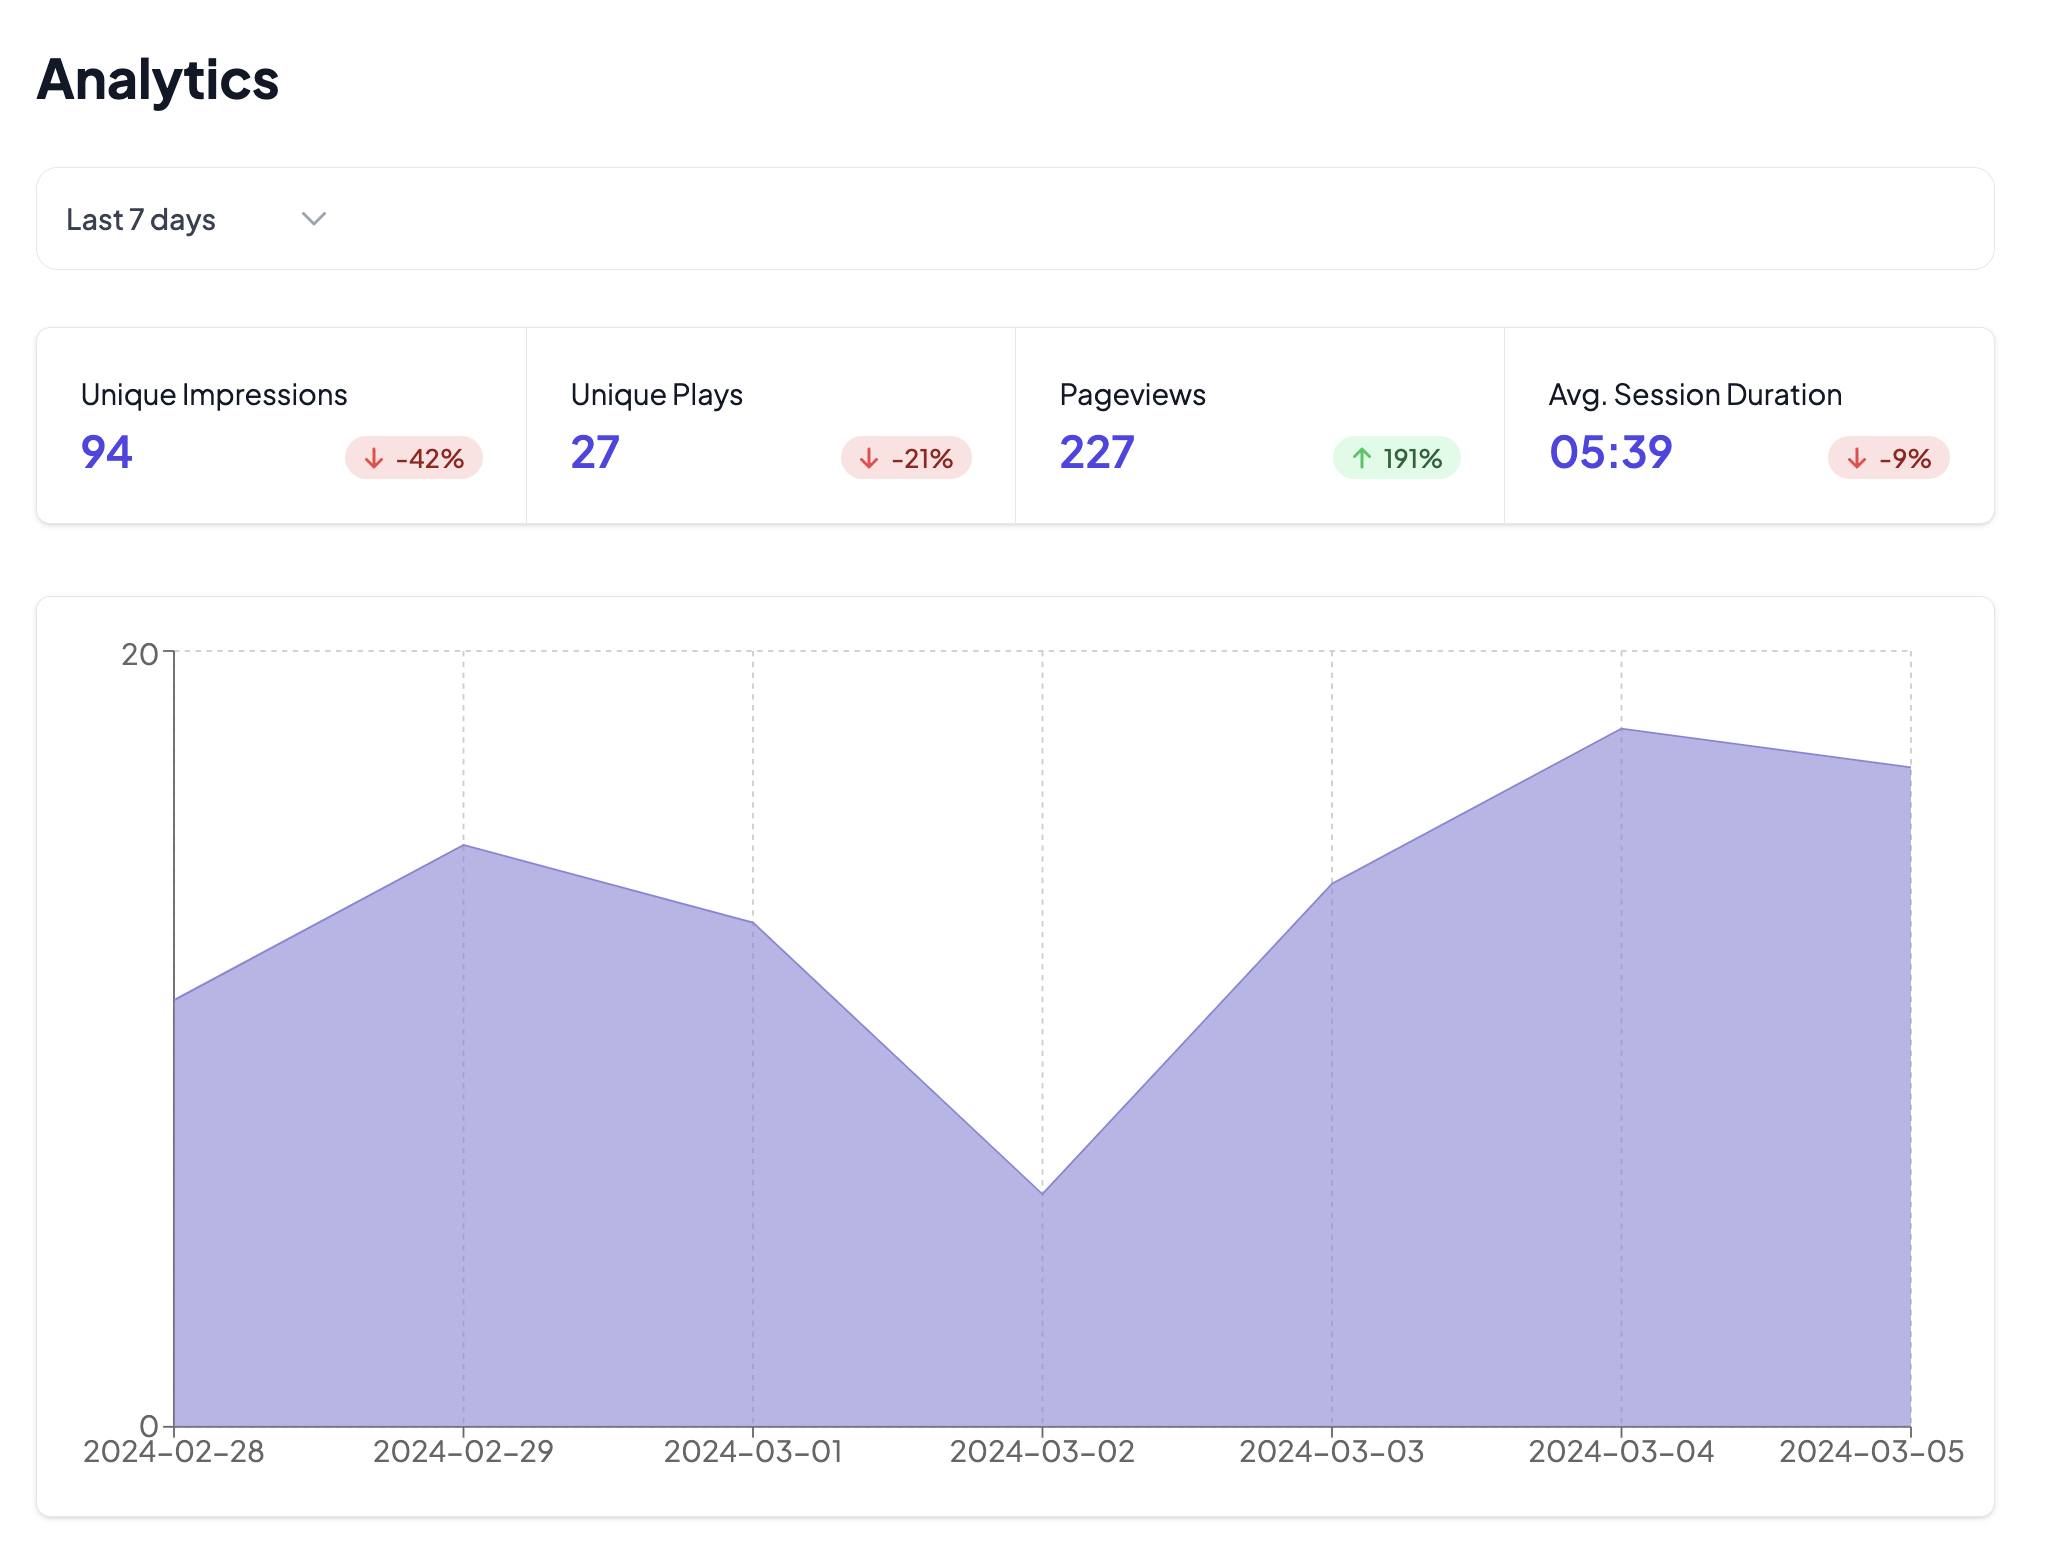
Explore the power of Sharelo's shoppable video platform today! Transform your trending TikTok videos into interactive shopping experiences directly on your website. With customizable pop-up, grid, or carousel views, you can seamlessly embed your videos and boost sales by engaging visitors like never before. Plus, leverage real-time analytics to measure success and refine your strategy. Don’t miss out on maximizing your content’s potential – start using Sharelo shoppable video now and watch your business grow!
What is Sharelo Shoppable Video
